

You ran your site through PageSpeed Insights, got a score in orange or red, and now you are staring at a list of audits wondering which one to fix first. Most people start with the big number at the top and the scariest-looking warning, and that is usually where the wasted afternoons come from. Here is how to read the report so your effort goes into what actually changes how your site feels to visitors.
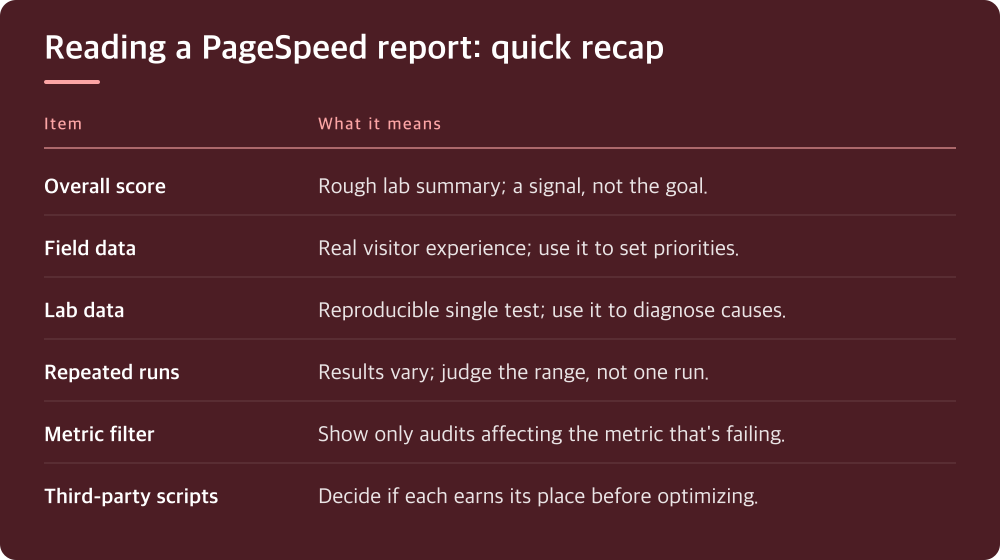
The score at the top is the least useful thing on the page
The big circular score is a weighted summary of a single simulated page load. It is calculated from lab metrics, run on a throttled virtual device, from a test location you do not control. It is useful as a rough signal, but it is not what your visitors experience and it is not what search engines use to judge your page experience.
The problem is that the score is the most visible element, so it becomes the goal. People install a plugin, watch the number jump, and call it done, even though nothing a real visitor would notice has changed. Others chase a perfect score on a page that already loads fine for everyone who uses it.
Treat the score like a thermometer reading taken in a different room. It tells you something is worth looking at, but it does not tell you where the problem is or whether your actual users feel it. The rest of the report is where the real information lives.
Once you stop treating the score as the target, the report gets much easier to read. Your job is to find out which specific experience is slow, for whom, and why.
Field data shows what real visitors felt; lab data helps explain why
Near the top of the report, there may be a section showing how real users experienced your page, drawn from Chrome usage data. This is field data. Below it is the lab diagnostic run. They answer different questions, and mixing them up is the single most common reading mistake.
Field data reflects actual visits over a rolling period, across real devices and real connections. If it says your Largest Contentful Paint or Interaction to Next Paint is in the poor range, real people are waiting. That is the data that matters for both users and search visibility, so it should set your priorities. Check Google’s current Core Web Vitals documentation for the exact thresholds, since they are defined there and occasionally revised.
Lab data is a single controlled test. It is valuable because it is reproducible and comes with diagnostics, but it can disagree with field data in either direction. A page can look terrible in the lab and fine in the field because your audience mostly uses fast devices, or the opposite if your visitors are on older phones.
If your page does not have enough traffic, the field section may be missing or fall back to origin-level data for the whole site. That is normal for smaller sites. In that case, lean on lab data for diagnosis, but stay skeptical of small changes, and consider using the Core Web Vitals report in Search Console if your site is verified there, since it groups pages and shows trends over time.
Run the test more than once before you believe any of it
Lab results vary between runs. Server response time fluctuates, caches may be cold or warm, third-party scripts load differently, and the test machine itself has variance. A single run that comes back worse than yesterday may mean nothing at all.
Before you change anything, run the same URL several times and note the range, not just one result. If the numbers swing widely, that variability is itself a clue. Inconsistent server response often points at hosting resources, an uncached page, or a slow database query rather than front-end bloat.
Test the mobile and desktop tabs separately and pay more attention to mobile. The mobile test uses heavier throttling, so it exposes problems that a fast desktop connection hides. It is also usually closer to what a large share of visitors experience.
Test the pages that matter, not just the homepage. Your homepage is often the most polished page on the site. A product page, a blog post with embedded media, or a page built with a heavy page builder will usually tell you more. Pick one URL per template type and use those as your baseline set.
Fix the metric that is failing, not the audit with the biggest red icon
The Opportunities and Diagnostics sections list every audit that could be improved, but they are not ranked by how much they help the metric you actually need to fix. An audit can look alarming and contribute almost nothing to the problem your visitors feel.
Start from the metric. If Largest Contentful Paint is poor, look at what the largest element is; the report identifies it. Then ask why it is late: slow server response, a render-blocking stylesheet, a large unoptimized hero image, or an image loaded lazily when it should load right away. Each cause has a different fix, and only one or two usually matter.
If Cumulative Layout Shift is the problem, look for images and embeds without reserved dimensions, late-loading fonts, ads, or banners that push content down. If interaction responsiveness is poor, the culprit is usually JavaScript keeping the main thread busy, which often traces back to plugins, page builders, or third-party tags.
Most PageSpeed reports let you filter audits by the metric they affect. Use that filter. It turns a long list of warnings into a short list relevant to the number you are trying to move, and it keeps you from spending a day on something that was never the bottleneck.
Some recommendations are not worth acting on, at least not yet
Third-party scripts show up constantly: analytics, chat widgets, embedded videos, ad networks, tag managers. The report flags them, but you cannot optimize code you do not control. The real decision is whether each script earns its place. Removing a widget nobody uses often helps more than any setting.
The reduce unused JavaScript and unused CSS audits are common on WordPress sites because themes and plugins load assets on every page. Aggressive fixes, such as stripping or deferring scripts with an optimization plugin, can break menus, forms, or checkout. If you go that route, change one setting at a time and click through the pages that matter after each change.
Server response time warnings deserve attention, but the fix depends on your setup. Page caching, object caching, PHP version, and the resources available on your plan all play a part. Where these settings live varies by host, so check your hosting control panel and your host’s documentation before assuming you need to move or upgrade.
Be wary of fixes that only improve the test. Some tricks delay everything until user interaction, which can make lab numbers look good while making the page feel broken to a real visitor. If a change makes the score better but the page worse to use, undo it.

What to do today: set a baseline and fix one thing properly
Pick three or four URLs that represent your main page types. Run each one through PageSpeed Insights several times on mobile, and write down the field data status for each Core Web Vital plus the range of lab results. That is your baseline. Without it, you cannot tell whether anything you do later actually helped.
Look at the field data first. Find the one metric that is failing or closest to failing on the pages that matter most. Ignore the overall score while you do this. Then filter the audits to that metric and identify the single most likely cause.
Make one change, clear any caches your site or host uses, and retest the same URLs the same way. If the lab numbers improve consistently across runs, keep the change. If they do not, or the page behaves differently for a visitor, roll it back and try the next cause.
Field data takes time to reflect changes because it is gathered over a rolling window, so do not expect it to shift the same day. Check back over the following weeks in PageSpeed Insights or Search Console. Slow, verified improvements to the metric that is actually failing will do more for your site than any number of late nights chasing a green circle.
Do this today
- Choose one URL for each main page template
- Run each URL several times on mobile
- Record field data status for each Core Web Vital
- Filter audits to your single worst metric
- Make one change, clear caches, then retest
※ This is informational and not a recommendation of any specific product or company.